


There are currently more than 1.9 billion websites on the internet out of those more than 200 million sites are active. Millions of users browse those sites daily.
Getting users’ attention to stay on the site for long can be a pain when your site loads in more than 7 seconds. Users will stick to your site if it loads fast. Having a fast loading time is a must in today’s time.
Every browser has a Lighthouse section that shows your site’s Performance, Accessibility, Best Practices and, SEO. For this blog, we’ll go over the Performance section and learn about its 6 metrics that contribute to overall performance.
Metrics
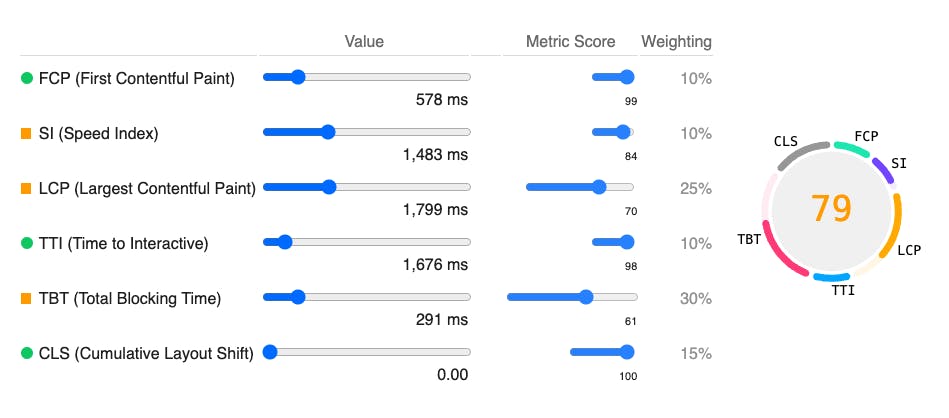
There are 6 metrics in the Performance section, each of them has a different weighting. Each metric captures some aspect of page load data which is then combined to form a Performance score.
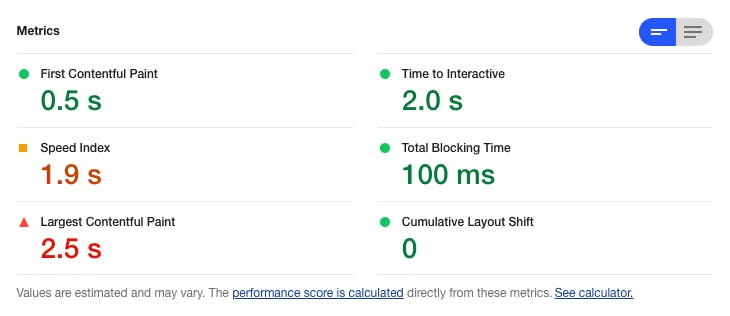
- First Contentful Paint (FCP) - 10%
- Speed Index (SI) - 10%
- Largest Contentful Paint (LCP) - 25%
- Time to Interactive (TTI) - 10%
- Total Blocking Time (TBT) - 30%
- Cumulative Layout Shift (CLS) - 15%
1. First Contentful Paint
FCP measures the amount of time it takes the browser to render DOM content. Eg. Images, Text, SVGs, etc.
FCP score is determined by comparing it with your page’s FCP time with real websites FCP time. Sites performing 99% in this metric have 1.2s of FCP. So if your site’s FCP is < 1.2s, your FCP score is 99, which is excellent. Your site’s FCP should be in between 0 to 1.8s.
FCP score can be improved if your site’s font load time is fast.
2. Speed Index
According to web.dev Speed Index measures how quickly content is visually displayed during page load. Lighthouse captures a video of the page loading in the browser and computes the visual progression between frames.

The Speed Index score is determined by comparing your page’s speed index and the speed indices of real websites.
As stated by How Lighthouse determines your Speed Index score a good Speed Index is 0-3.4s. But it should ideally be under 2s.
Speed Index score can be improved indirectly while improving your overall page load speed.
3. Largest Contentful Paint
LCP score should be taken seriously considering the 25% weightage among all the metrics.
According to web.dev LCP measures when the largest content element in the viewport is rendered to the screen.
There are a few types of elements that are considered for LCP. <img> <image> <video> are the few elements, more here.
For the most part, LCP is affected by four factors:
- Slow server response times
- Render-blocking JavaScript and CSS
- Resource load times
- Client-side rendering
Fixing these and also optimizing your CSS, Images, Fonts, and Javascript can help lower the score.
4. Time to Interactive
At some point in time, while browsing the web, you might have come across a few sites that are un-interactive for a few seconds even after the content is rendered on the screen.
According to web.dev TTI measures how long it takes a page to become fully interactive. A page is considered fully interactive when:
- The page displays useful content, which is measured by the First Contentful Paint,
- Event handlers are registered for most visible page elements, and
- The page responds to user interactions within 50 milliseconds.
Though TTI only has 10% weightage among all the metrics it is important because of the user experience it creates for the user in the first few seconds of their visit.
According to How to improve your TTI score you can improve your TTI score by removing unnecessary Javascript. A 0-3.8s score is considered to be good.
5. Total Blocking Time
TBT has the highest weightage of 30% among all the metrics. Though it has the most weightage its score is determined by FCP and TTI.
According to web.dev TBT measures the total amount of time that a page is blocked from responding to user input, such as mouse clicks, screen taps, or keyboard presses. The sum is calculated by adding the blocking portion of all long tasks between First Contentful Paint and Time to Interactive.
Though it has the most weightage its score is determined by FCP and TTI. So both of these metrics are very important for TBT score.
TBT score can be automatically improved by improving FCP and TTI score.
6. Cumulative Layout Shift
Have you ever been scrolling through a site and suddenly something changes on the page? Some text, link, or button just appears suddenly. Worse would be if you are about to tap on some link and suddenly you end up clicking a different link. Here is a video demonstrating that behavior:

According to web.dev CLS is a measure of the largest burst of layout shift scores for every unexpected layout shift that occurs during the entire lifespan of a page.
A layout shift occurs any time a visible element changes its position from one rendered frame to the next.
As stated by How to improve CLS you can improve CLS score by these 3 principles:
- Always include size attributes on your images and video elements, or otherwise reserve the required space with something like CSS aspect ratio boxes.
- Never insert content above existing content, except in response to a user interaction.
- Prefer transform animations to animations of properties that trigger layout changes.
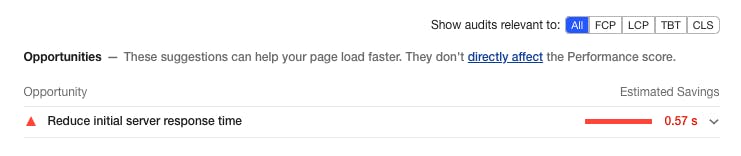
Below the metrics section, there is an Opportunities section that suggests some key opportunities to improve that indirectly affect the performance score.
Speeding up sites is a pain nowadays considering all the little things to keep in mind. I hope you liked the summed-up version of Performance metrics, how it affects your site's speed and how you can improve them.
I consulted the following website for my research https://web.dev/lighthouse-performance/
Thanks for Reading. Let’s talk!